~/blog/home-assistant-pv-g13-heat-pump-winter-optimisation
Home Assistant energy controller: PV, G13 and heat pump
How I built PV, battery and G13 automation in Home Assistant, where winter heat pump control stands, and what is measured versus estimated.
A house with photovoltaics, a home battery, a time-of-use tariff and a heat pump is an energy system whether or not anyone designed it as one. The inverter decides where the sun goes, the battery decides when to charge, the utility decides what an hour of electricity costs, and the heat pump decides how much of that bill becomes warm floors. Without a controller these decisions are made by four different devices that do not know about each other. This article describes the controller I built in Home Assistant around that system: the hardware, the signals it runs on, the battery and tariff logic that is live, and the winter heating optimisation that is still in shadow mode. It also covers the parts that went wrong, because the mistakes taught more than the design did. Nothing here is a finished product. The heating loop in particular has not yet been allowed to write to the pump, and the numbers I give are either measured or labelled as estimates.
The problem, stated plainly#
Three things were true in my house before I started. The roof produced more than the house used in summer and almost nothing in the darkest weeks of winter. The Polish G13 tariff charges roughly 2.4 times more per kilowatt-hour in the afternoon peak than in the off-peak hours, and the peak window moved between seasons. And the heat pump heated the floor on its own weather curve, with no notion of when electricity was expensive.
The goal was not to make the house clever. It was to make four decisions with the same information: when the battery charges, when it holds, when the heating pushes and when it coasts, and how much of the surplus solar goes to which load. Every decision needs three things. A price, a physical state, and a forecast.
The hardware#
| Component | What it is | Why it matters to the controller |
|---|---|---|
| Single-board computer | Raspberry Pi 5, Home Assistant OS | Runs Core, the recorder and every integration locally |
| PV array | About 10 kWp, east-west orientation | The shape of production is flatter than south-facing, which matters for evening export |
| Inverter and battery | Huawei inverter with a LUNA2000 battery, about 10 kWh nominal, roughly 9 kWh usable | Battery state, working modes and the time-of-use schedule are all set on the inverter; Home Assistant reads and writes them |
| Grid meter | Power meter read through the inverter | Source of import, export and signed grid power |
| Heat pump | Kaisai KMK-100RY3 hydraulic module, Midea M-Thermal platform, 6 kW backup heater | The load I most wanted to shift; heats the floor through zone 1 and the domestic hot water tank |
| Buffer | 100 litre buffer tank on the heat pump | Small thermal mass, so it smooths compressor cycling more than it stores energy |
| Underfloor heating | Screed floor, zone 1 | Large thermal mass with a slow response, which is the whole reason heating can be shifted |
| Heat pump integration | midea_ac_lan, local LAN | Exposes the zone and hot water attributes; the only path to write settings |
| Tariff | Tauron G13 with an RCEm net-billing prosumer account | Prices come from the tariff helpers; export is valued at the RCEm price times a coefficient |
| Smart plugs | Matter plugs measuring washer, dryer and a server | Appliance power, and one reason the appliance state sensors needed a second source |
| Vehicle | Tesla, monitored through TeslaMate over MQTT | Its charging takes solar surplus and is a competitor for the same power |
| Forecasts | Solcast for PV, met.no for weather, Open-Meteo as a fallback | PV and temperature forecasts for tomorrow and the next six hours |
| Indoor sensors | Zigbee and Matter temperature sensors, four in total | Room temperature for the heating regulator, averaged across the house |
The Pi is the only machine that runs Home Assistant. The Tesla, the cameras and the appliances reach it over the local network or through cloud and MQTT integrations. Some of those integrations go quiet without warning, which matters below.
The platform, briefly#
Home Assistant OS 18.0 on the Pi, Core 2026.7.4 on stable at the last full inventory, SQLite as the recorder. That inventory counted about 860 entities across 33 domains, with twelve areas and nine dashboards. Most of the energy logic lives in YAML packages, one file per subsystem, included from configuration.yaml. Helpers, which are the input booleans, numbers, selects and text fields the automations read and write, are created through the UI or the configuration flow rather than by hand in YAML.
Two platform facts shape everything below.
The first is that raw history and long-term statistics are different things. The recorder keeps raw state history for about ten days. Long-term statistics are hourly aggregates kept indefinitely. In my case the raw history reached back only about seventeen days after a database problem, but the statistics were recovered and now go back to January 2025. Any analysis longer than a week has to read statistics, not states. The recovery is described in a decision note, including a side effect: some sums were negative before the repaired date, so any chart built over that boundary needs a caveat.
The second is that the registry remembers things the YAML forgot. Deleting an automation from automations.yaml does not delete its entity registry entry. I found six automations and two scripts that existed only as orphaned registry records, showing as unavailable after every restart, and removed them. The same mechanism explains a good share of the unknown and unavailable sensors in my domain counts. When a count of unavailable entities drifts, check the registry before you assume a broken integration.
The signals#
The controller is only as good as its inputs, and most of my debugging time went into signals rather than logic. This is the set the live logic depends on.
| Signal | Source | What it means | Known trap |
|---|---|---|---|
sensor.tauron_g13_strefa | Template sensor | Current G13 zone: peak morning, peak afternoon, off-peak | Originally knew only weekends, not public holidays. Fixed by using the workday integration for Poland as the single source of free days |
sensor.batteries_state_of_capacity | Inverter | Battery state of charge, percent | Overnight behaviour depends on the working mode, not on the number alone |
sensor.power_meter_active_power | Inverter meter | Signed grid power | Huawei publishes positive on export, the opposite of what the flow cards assume |
sensor.grid_import_power and siblings | Template helpers | Four unsigned helpers: grid import, grid export, battery charge, battery discharge | Created so new automations never re-derive the sign |
sensor.heat_pump_power | Energy counter derivative | Heat pump power draw | Resolution is one kilowatt-hour of the counter, so the signal is coarse; it can also stop updating for hours |
climate.*_zone1 attributes | midea_ac_lan | Zone state, set temperature (zone1_temp_set), outdoor temperature | temp_tw_out is null on this unit, and the outdoor reading is the pump's own sensor |
sensor.outdoor_temperature | Airly | Outdoor temperature | Carries a zero fallback when unavailable, so it reads 0°C when it fails; the heating logic uses the pump's sensor instead |
sensor.pv_forecast_today and _tomorrow | Solcast | Forecast PV production | Tomorrow's value drives whether to charge tonight |
sensor.elicznik_bill_data | eLicznik, Tauron AMIplus | Settlement data | Lags a day; the "through" date always excludes today |
sensor.room_temperature (averaged) | Four indoor sensors | Living space temperature | One room does not represent the house, so the regulator averages |
I want to dwell on two of these, because each one cost me a wrong conclusion before I caught it.
The export sign. The first version of the flow dashboard drew the power arrows backwards. The inverter reports export as positive, and the flow card assumed the reverse. Instead of guessing the convention in every automation, I created four unsigned template helpers, one each for grid import, grid export, battery charge and battery discharge, each computed with max(0, ...) on the correct sign. Any new automation uses those four. The rule is simple and it has saved me from at least one wrong branch: never derive a sign twice.
The outdoor temperature. I initially used the Airly sensor for outdoor temperature, because it was already in the system. Airly is a fixed station, and the pump's own sensor reads about 0.8°C cooler on average. The Airly template also fell back to zero when it failed, which in a heating controller is the worst possible value: it reads as a freezing day and pushes the house warmer. The regulator now reads the pump's outdoor sensor, uses the forecast only for the direction of change, and treats Airly as a last-resort fallback that is currently dead.
The tariff layer#
G13 is a time-of-use tariff with three zones on working days and a single cheap zone at weekends. Winter and summer windows differ. In the current winter schedule the morning peak is 07:00 to 13:00, the afternoon peak is 16:00 to 21:00, and the off-peak is 13:00 to 16:00 plus 21:00 to 07:00 and the whole weekend. The summer afternoon peak is shorter, 19:00 to 22:00. The exact prices are in tariff helpers and change with the tariff, so I do not copy them into logic; the logic reads them.
The tariff has to be a single sensor, and mine was not, at first. There were three separate copies of the zone rules: the template sensor, the battery optimiser's time windows, and the tariff view on the energy dashboard. A change to the tariff had to be made in three places, and I missed one. The fix in progress is to make the sensor the only source, and to have every other consumer read it.
The holiday problem is the example I return to. A public holiday on a working day falls into the peak zone in the template, because the template only knows weekends. Nothing about that is visible from the dashboard, and it shows up only as behaviour that does not match the tariff. The workday integration with the Polish calendar now provides the free-day list, and the template uses that. The same class of gap appeared in the day mask of the inverter's time-of-use windows, which for a while did not cover Fridays.
The battery and PV optimiser#
The battery logic is the oldest part of the system and the one with the most live behaviour. Its job is to use the cheapest energy for the house, using the battery as a store, and to avoid buying grid energy to charge the battery when the sun is about to do it for free.
The inverter has working modes, and the most important one for this job is time_of_use_luna2000, which follows a schedule of charge and discharge windows set on the inverter itself. Home Assistant does not drive the battery second by second. It chooses the mode and rewrites the schedule, which is safer and survives a Home Assistant outage. The optimiser runs on a periodic trigger, on a night-start trigger, on a morning check, and on startup, and it chooses among a small set of branches. Their names are the names I used in the decision notes, which is why they look like project jargon:
- JIT (just in time) computes how much charge is needed to reach the morning with enough energy, using tomorrow's PV forecast and the predicted house load.
- HOLD keeps the battery at its target through the cheap night zone and releases it at the morning peak boundary, the first zone change, at 07:00 or on startup. It exists because a battery that tops up from the grid at 04:00 buys energy at the off-peak price to store it, which is worth doing only when the battery will otherwise run dry.
- EMERGENCY handles a battery that is too low for the coming hours.
- Calibration compares the predicted overnight target with the real state of charge each morning and writes a report to Telegram at 13:00.
The invariant that governs all of this is stated in a decision note: the grid does not charge the battery while there is PV. A night-time grid top-up is correct when the sun will not refill the battery before the peak, and wrong in every other case. The decision note records that invariant and the reasoning behind it, and the optimiser is meant to respect it.
The bug that taught me the most#
The biggest mistake in this part was a single character. An emergency branch was meant to top the battery up by twenty points, capped at fifty percent, which is a min. I had written max. At 10% state of charge, max(30, 50) returns 50, so the battery was charged from the grid to half full every night in which the branch fired. It was caught by checking the overnight state of charge against what the optimiser had predicted, not by an alert.
The deeper problem was not the operator. It was the order. The emergency branch sat before the JIT branch in a choose block, and choose takes the first branch whose conditions are true. The emergency conditions were satisfied at 04:00 on a periodic trigger, so the more careful JIT calculation never ran. Fixing the operator was necessary, and it did not address that. The optimiser's decisions are now written to a text helper with a timestamp and the name of the branch, and a Telegram notification carries the same line. A decision log you can read is the cheapest debugging tool a controller can have.
The tariff and PV layer, running since April#
The heating work is the newest part of the controller. The tariff and PV layer is older and has been running since April 2026, and it has produced far more data. This section puts numbers on it.
The timeline matters, because the layer changed while it ran. The predictive battery logic went live on 13 April. On 30 July I fixed the emergency branch that had been topping the battery up from the grid overnight, and added a hold branch that keeps the battery at its target through the cheap night zone. On 3 August a rule went in that the grid does not charge the battery while there is PV. On 7 August the time-of-use day mask was found to be missing Fridays. On 1 September the G13 zones were applied to grid import and to house load separately, not just to the heat pump. On 3 October the workday calendar for Poland was wired into the G13 sensor, so public holidays count as free days. Every one of those changes moves the numbers below, so the monthly table is not a clean before-and-after of one design.
What the inverter and the meters saw#
The table is built from hourly long-term statistics from Home Assistant, not from the raw states, which expire after about ten days. House load is derived from the energy balance, yield + import − export + battery discharge − battery charge, and it ignores conversion losses.
| Month (2026) | PV yield, kWh | Grid import, kWh | Export, kWh | Battery charged, kWh | House load, kWh (balance) | Share of import in the T2 peak |
|---|---|---|---|---|---|---|
| April | 1 013 | 337 | 287 | 325 | 1 160 | 1.4% |
| May | 1 099 | 238 | 459 | 274 | 1 016 | 0.1% |
| June | 1 239 | 263 | 434 | 319 | 1 179 | 0.7% |
| July | 1 130 | 202 | 426 | 309 | 1 014 | 0.5% |
| August | 1 110 | 193 | 376 | 280 | 1 046 | 0.4% |
| September | 754 | 156 | 362 | 245 | 699 | 0.1% |
| October, to 6th | 132 | 8 | 58 | 39 | 110 | 0.4% |
Two things stand out. Grid import fell from about 490 kWh in March to about 160 kWh in September, and the house drew less from the grid through the same months. I have not separated the effect of the array's seasonal production from the effect of the battery logic, so the table does not attribute the drop to either. The second is the T2 column. The afternoon peak, which is the most expensive G13 zone, accounts for well under two per cent of grid import in every month. The battery covers almost all of it, which is what the battery logic is for.
What it was worth, as a model#
I modelled the battery's arbitrage on the import side. For each hour, I compared the grid import I actually paid for with what I would have paid if the battery had never existed, so the house would have drawn directly from the grid whenever the PV and the house did not balance. The price per zone was 0.91 PLN per kWh for T1 (07–13 on working days), 1.45 PLN for T2 (16–21 in winter, 19–22 in summer) and 0.63 PLN for T3 (everything else, weekends included). The zone prices are from my tariff notes, not from the live helpers, so treat the result as an order of magnitude.
| Month | Modelled import saving, PLN |
|---|---|
| April | 130 |
| May | 144 |
| June | 171 |
| July | 159 |
| August | 175 |
| September | 158 |
| April to September, total | about 940 |
The model leaves out the value of exported energy, the battery's conversion losses and public holidays. Export is the main missing term, and it matters. The Tauron billing data counts more export than the inverter does, which is the next point.
Where the meters disagree#
The Tauron importer is the billing source, and it does not agree with the inverter. In April, the Tauron consumption series adds up to about 535 kWh, against 337 kWh from the inverter's grid meter. The Tauron generation series, which is export, adds up to about 480 kWh, against 287 kWh from the inverter. The gap is roughly 1.6 to 1.8 times in both directions, and it persists through September. I have not resolved it. Until I have, the model above is a model on the inverter's meter, and the bill is the number to trust for money. This is the first thing I would check before publishing any savings figure.
The eLicznik sensors the dashboard shows are built on the billing series. In the snapshot from 30 July they put the PV saving at 1 346 PLN, computed as the counterfactual bill without PV minus the real bill. The method assumes the whole house would otherwise buy its energy on a static hourly profile of the zones, and the sensor's own documentation calls it a hypothesis, not a measurement. I quote it here only as the sensor's figure, and I do not endorse it.
What the layer does not do#
It does not shift the house's own load in time. The washing machine, the dryer and the dishwasher are tracked by the energy dashboard and by an advisor that sends a notification when a cheap window opens, but nothing switches them on by itself. The Tesla charges from the surplus, and the surplus competes with the heating boost, as described above. And the battery's schedule is written into the inverter, so when Home Assistant is down, the inverter keeps the last schedule it was given. That is a benefit in one sense and a risk in another, and I have not tested the second.
Winter heating: the problem#
Underfloor heating is the best possible load to shift, and the worst to measure. The floor is a large mass, so heat put in at 04:00 is still there at 18:00, and a house can coast through a peak on stored heat. The heat pump is the instrument for doing that, and it is also the place where the problems start.
The first constraint is the pump's own minimum. In a test the Midea interface did not accept a water setpoint of 24°C, and its minimum is 25°C. So the controller cannot simply turn the zone down to save money; below 25°C the only option is to switch the zone off. The second constraint is the backup heater. Its six kilowatts are a coefficient-of-performance-one load, the most expensive heat the system can make, and it starts when the water is about five degrees below the setpoint for thirty minutes. A controller that lowers the setpoint aggressively in the afternoon can provoke the heater on the way back up. The third constraint is that I had no reliable indoor temperature for the house. The sensor I bought, together with the existing ones, gives four readings in total, and until it was in place the heating controller could not know what the house felt like.
The fourth constraint is data. The pump's own energy history only covers summer, because its meter was reset in April. The only winter signal is the whole-house load, and it does not separate heating from hot water. I had no measured coefficient of performance below about 5°C. Any winter model I built would be a model of a season I had not observed.
Winter heating: the design that is in shadow#
The design went through three versions in a few weeks, and the changes are the substance of the story.
The first plan was a set of modes with hysteresis. The pump's own weather curve would be replaced by a water-temperature target derived from outdoor temperature plus an offset, and the offset would depend on a mode: comfort protection, a floor-warming boost from solar surplus, a coast during the afternoon peak, and normal operation otherwise. I chose the modes because they are explainable. On review I cut the morning windows entirely: once the losses from a lower coefficient of performance and the collisions with hot water were counted, the morning shift was not worth its complexity.
The second version was an open-loop model: a price vector times an estimated coefficient of performance, mapped to a target. It was elegant on paper and depended entirely on constants I had guessed, starting with the COP at 7°C and the pump's draw while heating. I replaced it.
The third version is the current one, a regulator with feedback from the room. The cost vector stays, but it no longer sets the pump. It moves the room target within a comfort band of 21 to 23°C. A cheap or solar-surplus hour pushes the target toward the top of the band; an expensive hour pushes it toward the bottom. The pump's water setpoint is then adjusted in one-degree steps, at most every two hours, measured from the setpoint the pump actually reports rather than the one the controller last wrote. The step is held back when the house temperature trend already points at the target, and frozen while hot water is heating and for thirty minutes afterwards. The zone is switched off when the house is warm enough and the water target would fall below the pump's floor, and it is switched back on only after the minimum run and rest times.
Two design decisions in this version are worth stating, because they go against habit.
The first is that there is no fail-safe that returns the pump to its own curve when Home Assistant stops. The original plan had one. I dropped it after concluding that if Home Assistant goes down, the pump's heating is unlikely to continue in any useful way. I have not tested that, and the decision note says so. The consequence is real: if the controller stops while the zone is in manual mode, the pump keeps the last setpoint without a time limit, so the depth of any reduction has a ceiling until that behaviour is observed.
The second is that the verification step was dropped. The plan was to write a setpoint and read back the value two minutes later, raising an alarm if they differed. A write test on the live pump showed the protocol accepts the write, but the reported setpoint did not change for over two minutes, and the reported value can lag by eight seconds to forty minutes. A two-minute check would fire an alarm on every change. The write is confirmed by the protocol and the physical effect is confirmed by the house temperature over hours, not by the pump's report.
Where it stands#
As of this writing the regulator runs in shadow mode. It computes the action it would take, writes the outcome to sensors, and sends nothing to the pump. The sensors are the record for next winter: the setpoint the pump reports, the outdoor temperature from the pump, the hot-water state, the heating state, and the fraction of each hour the zone runs. Phase two, which lets the controller write, waits on two things: an explicit go-ahead, and a comparison of the shadow recommendations with the manual setpoints I was choosing in the meantime.
I am not claiming a saving yet. I will publish the measured numbers in spring, once a full heating season and a control period are in the record.
Coordination: one heat pump, several controllers#
The heat pump is one device with one local connection. Three things want to write to it: the heating regulator, the hot-water optimiser that is planned but not built, and the solar fast-hot-water logic that is live. If each controller writes whenever it likes, they will overwrite each other, and the write order will decide the outcome.
The plan is a single write path: one script with mode: queued that all controllers call, so writes happen in order and none is lost. Solar fast hot water takes precedence, because it uses surplus that would otherwise be exported for less. The heating regulator freezes its steps while hot water is heating, because the compressor cannot do both at once.
The Tesla is the other competitor for the surplus. Its charging logic takes solar surplus, so the surplus is shared between the car, the battery, the pump and the hot water, and the order of precedence is a decision, not an accident. The current rule is that the car takes priority, and the heating boost takes only what remains. That order matches the value I put on each load. It is not proven to be the best order, and the decision note marks it as to be confirmed in operation.
Dashboards: what to look at#
The dashboards answer different questions, and I try to keep each panel tied to one decision. The Grafana PV dashboard answers what the array is doing now and how it compares with the forecast. The house dashboard answers where the energy goes. The Home Assistant energy view is organised the same way, by decision rather than by data source.
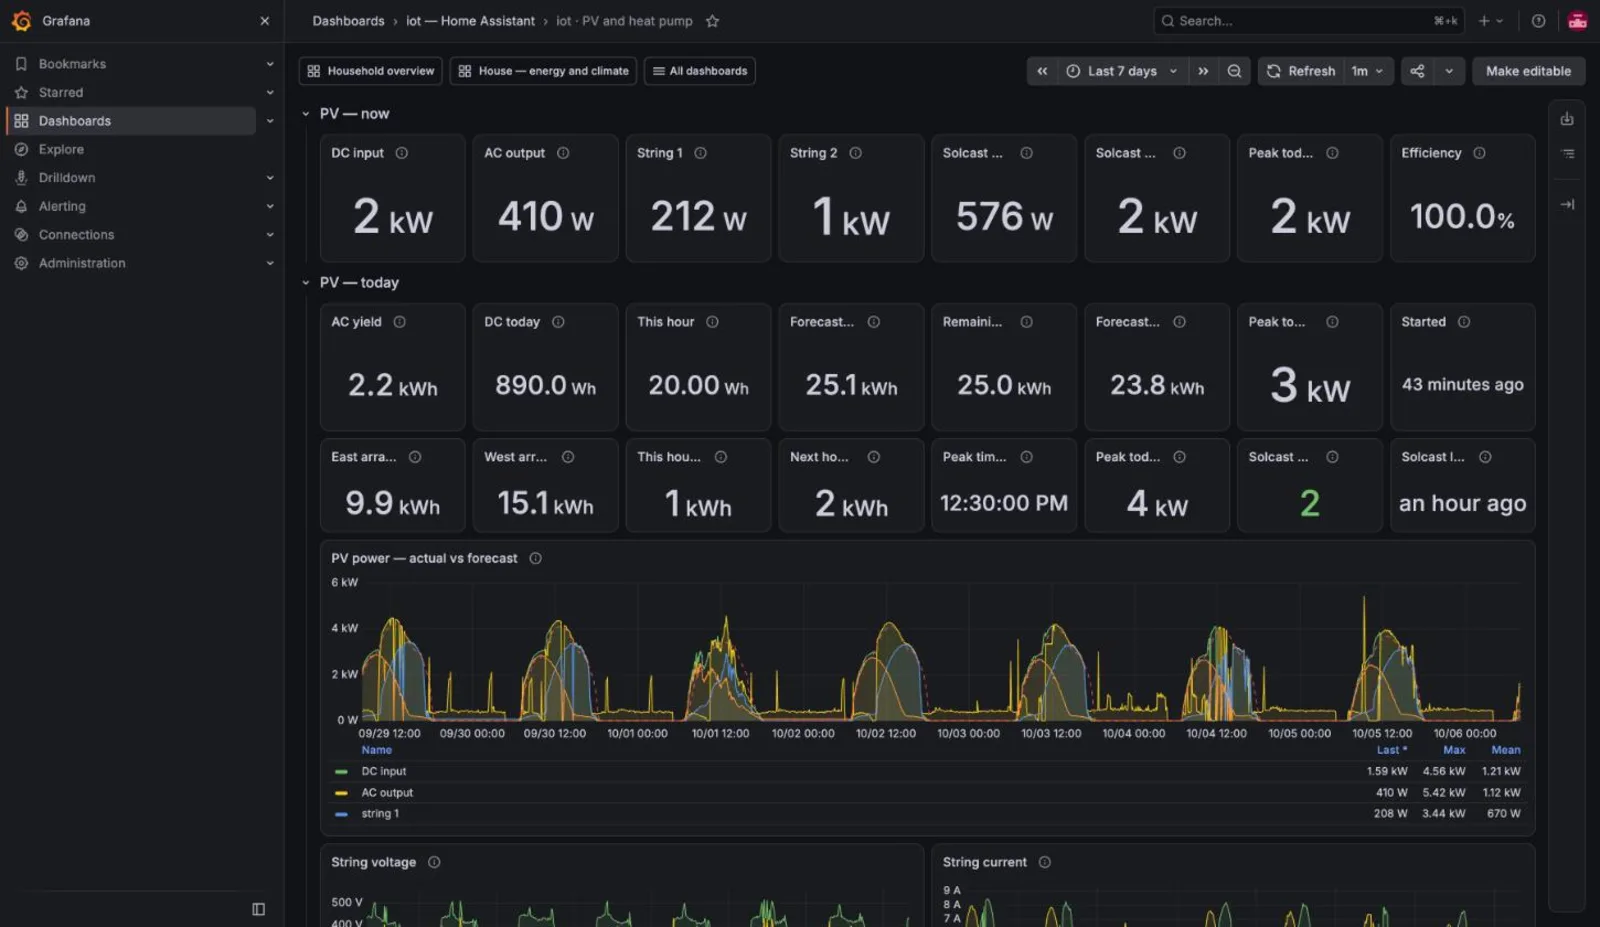
The PV dashboard, last seven days. The top row shows the array right now, the middle row the day's yield, the forecasts and the peak, and the chart underneath plots actual PV power against the forecast. The east and west arrays appear as separate figures. For an array facing both ways, the east side produces in the morning and the west side in the afternoon, so part of the afternoon the battery has to cover comes from the west array.
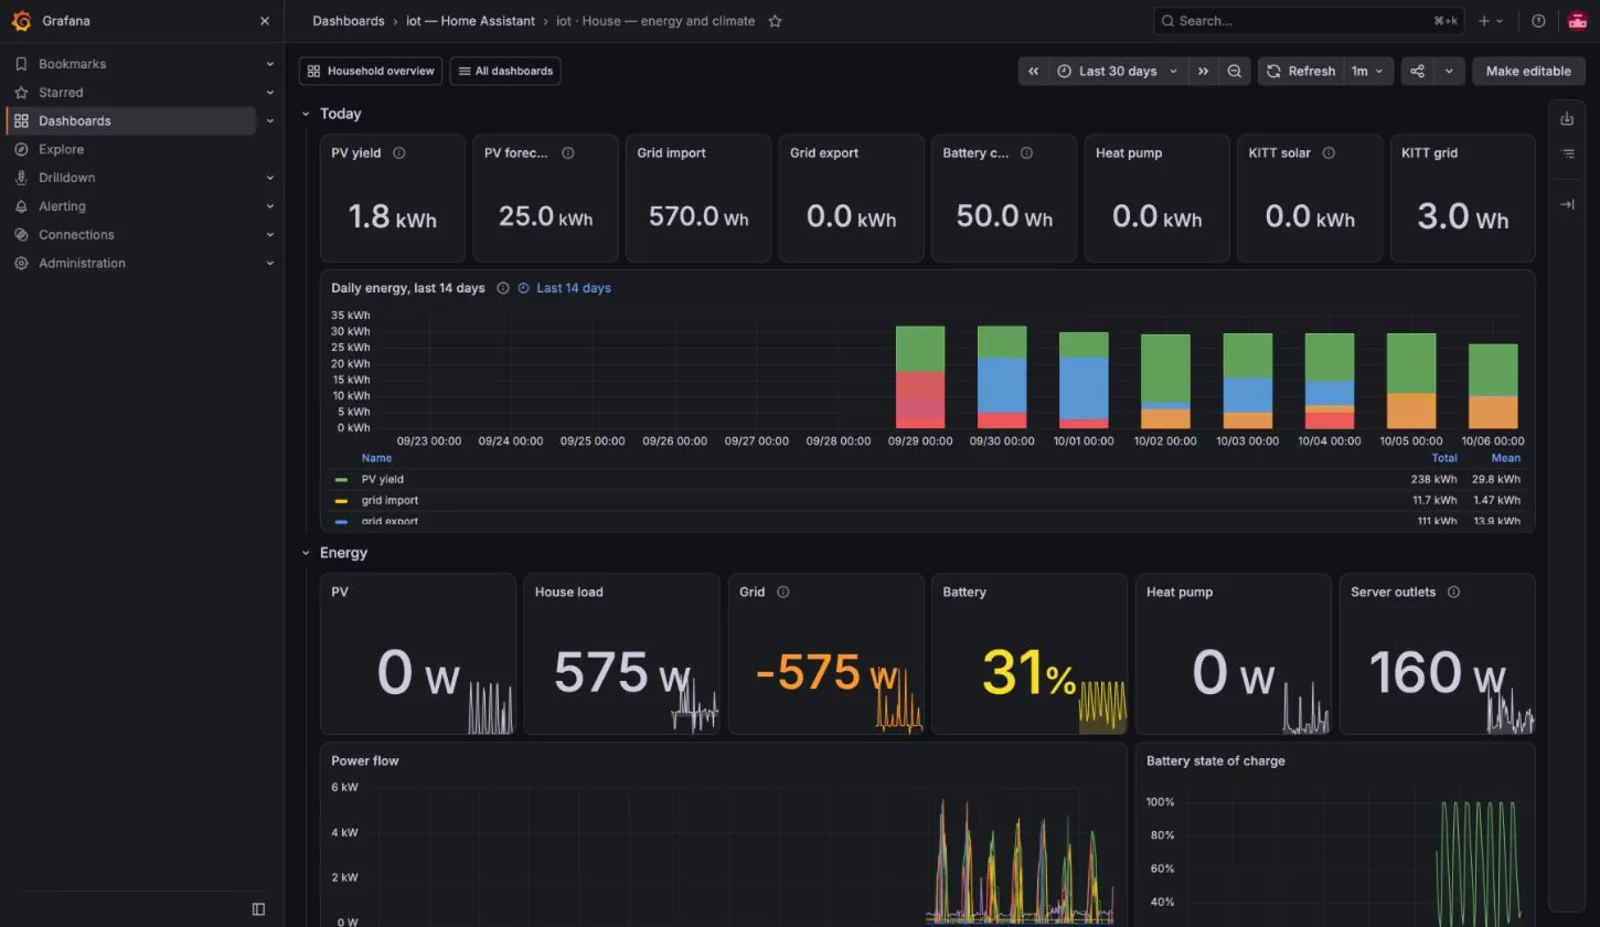
The house dashboard. The daily energy chart stacks PV yield, grid import and export by day, and the battery state of charge below it reaches 100% each day. The grid tile reads negative at the moment of capture because the house is exporting. The overnight target and the morning reserve are read from the same battery trace.
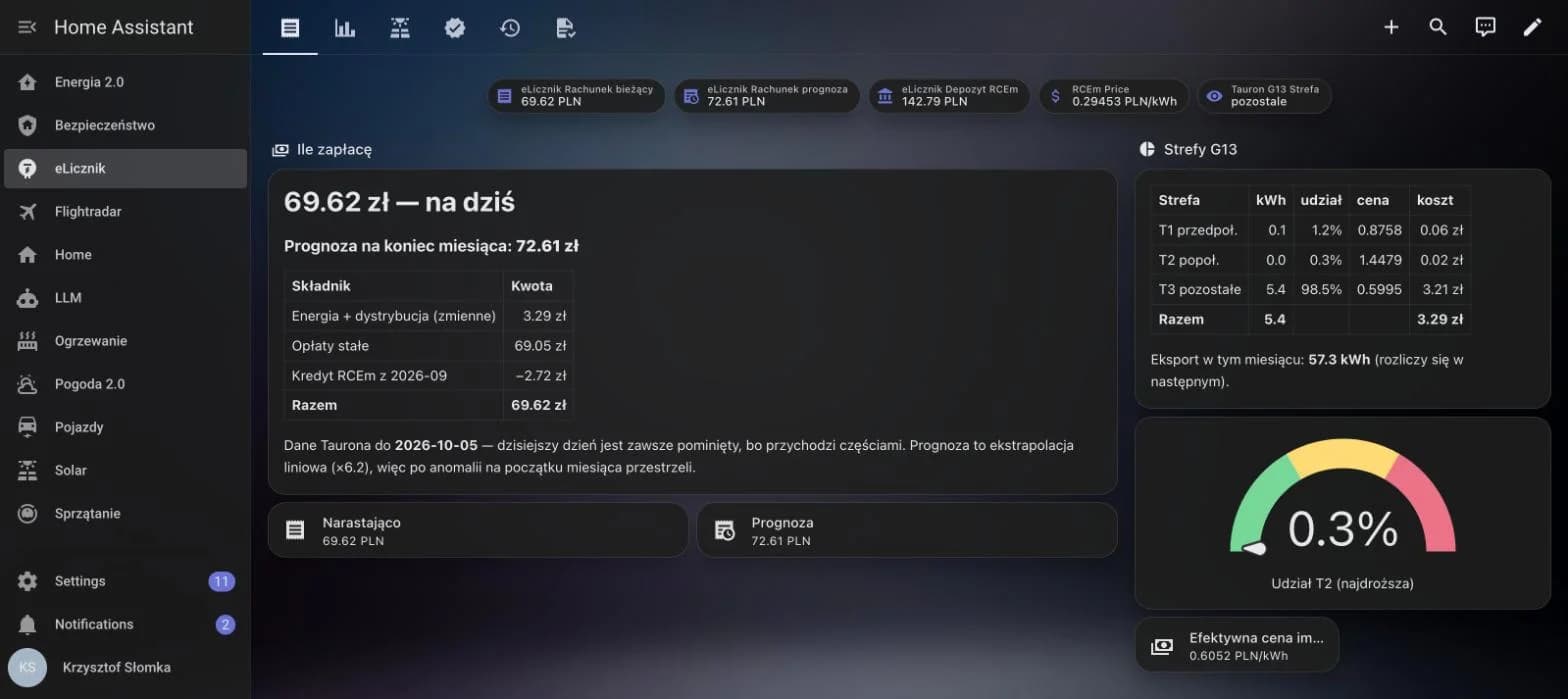
The money panel in Home Assistant. The bill is the running total for the month so far, the forecast extrapolates it to month end, and the table shows what makes it up: variable energy and distribution, fixed fees, and the RCEm credit.
Money lives here and nowhere else. Duplicating a bill figure in two places guarantees that they disagree eventually.
Grafana sits alongside this for longer-range charts, and the same rule applies there: one panel, one question. The money panel lives in Home Assistant, not Grafana. I keep the money on one panel and the physics on another. The reason is the same as the reason for one sign convention: two displays of the same number drift.
Heating is still in progress#
I am working on the heating regulator right now, and I will publish its results in spring. The regulator is in shadow mode: it computes what it would do and writes nothing to the pump. Until it has run through a full heating season, with a control period to compare against, any saving I could quote would be a guess. So this article does not claim one.
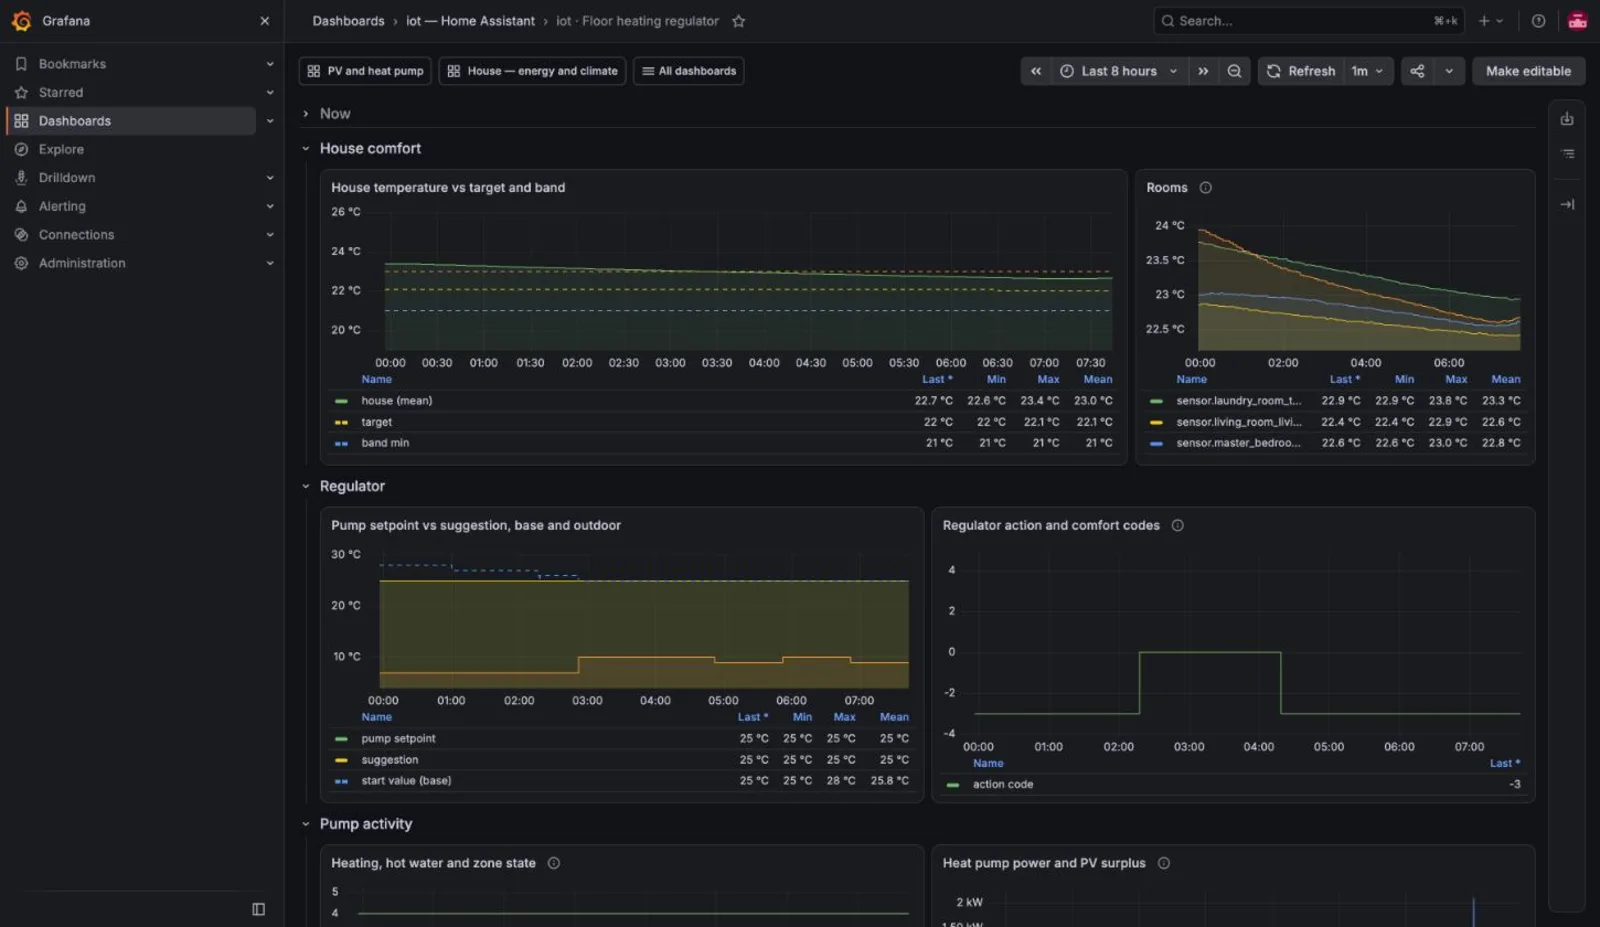
The regulator dashboard in shadow mode. The pump setpoint and the regulator's suggestion both sit at the 25°C floor, while the start value is 25.8°C. The suggestion is recorded and nothing is written.
What I can say today is what the first week looks like. The house temperature stays inside the comfort band, the pump setpoint stays on its floor, and the regulator's suggestion matches the setpoint, as the dashboard above shows. The next steps are the comparison against my manual setpoints and a decision on whether the regulator is allowed to write.
What I predict, written down before the data#
Writing a prediction down now is the only way to check it in spring. These are dated 6 October 2026. They use the tariff prices I took from the decision notes, 0.63 PLN per kWh off-peak, 1.45 PLN per kWh afternoon peak on the tariff, and 0.67 PLN per kWh for battery energy used at the peak, and they assume the regulator starts writing to the pump.
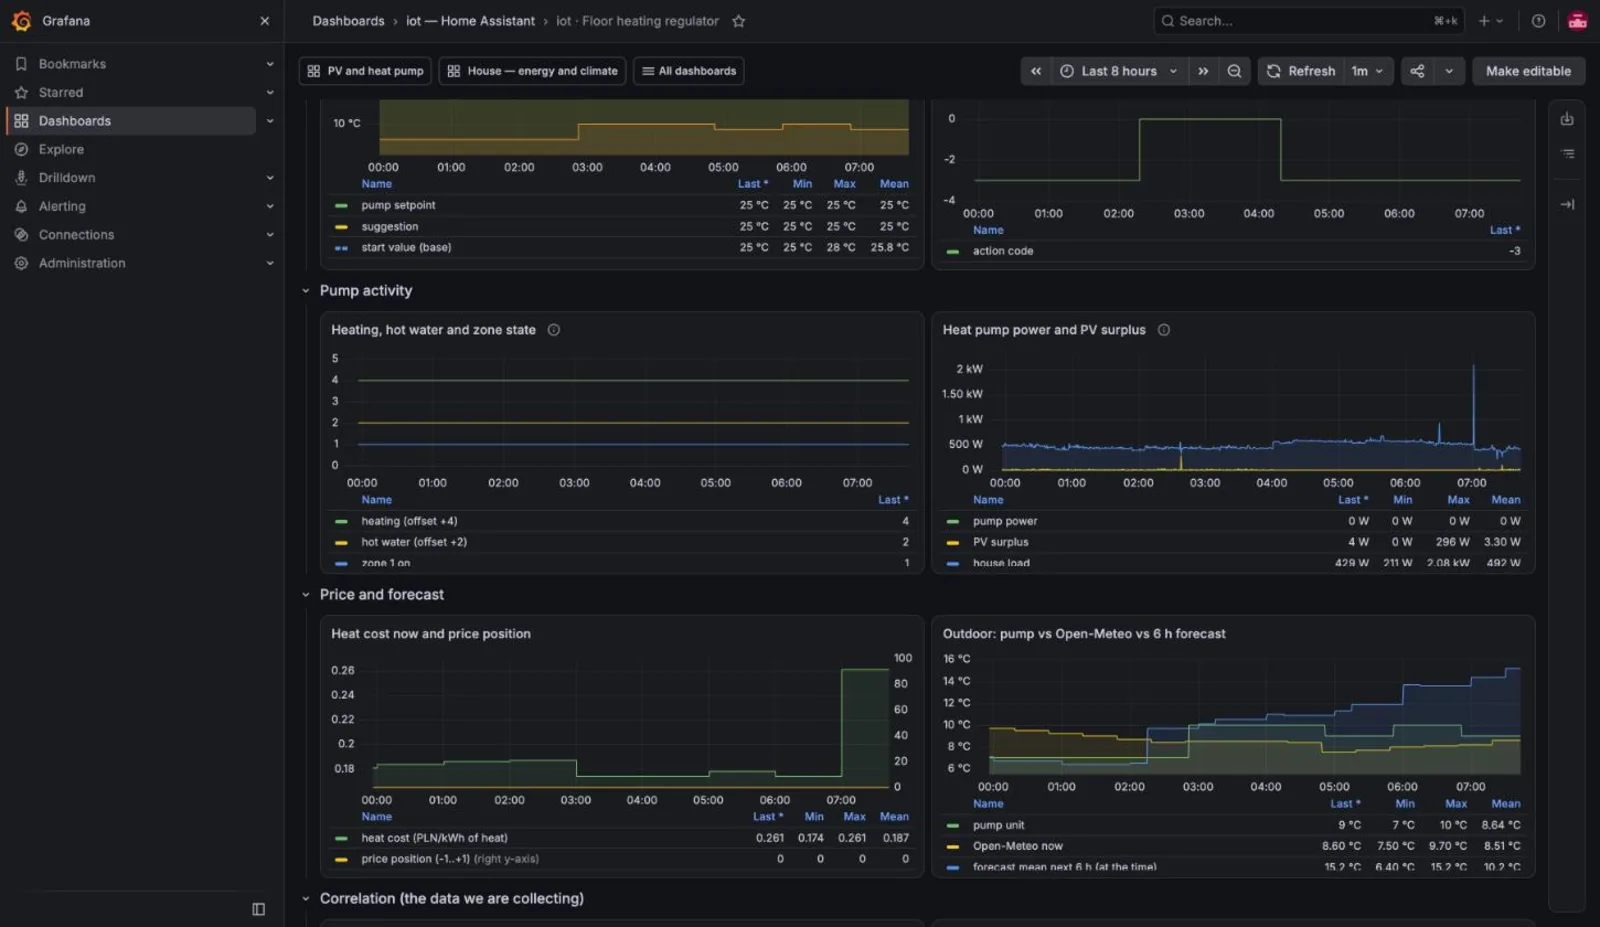
The price and forecast panels. The heat cost jumps to about 0.26 PLN per kWh of heat in the peak hour, the pump's own sensor reads 9°C against 8.6°C from Open-Meteo, and the six-hour forecast climbs to about 15°C.
The model is simple. Shifting one kilowatt-hour of heat pump electricity out of the afternoon peak saves the peak price minus the off-peak price. The peak price depends on how much of the peak the battery covers. Where the battery covers it, the peak costs about 0.67. Where the grid covers it, the peak costs about 1.45. The predicted saving per month is then the energy shifted per day times the weighted peak price minus 0.63, times thirty days.
| Share of afternoon peak covered by battery | Shifted per day | Predicted saving per month |
|---|---|---|
| 70% or more (sunny spell, full battery) | 1 to 3 kWh | 2 to 25 PLN |
| 30 to 50% (typical winter) | 1 to 3 kWh | 13 to 53 PLN |
| near 0% (battery empty at the peak) | 1 to 3 kWh | 25 to 74 PLN |
My central prediction for a typical winter month is about 20 to 40 PLN, and the most likely single outcome is around 30 PLN. That is small next to the house's total bill. The reason is that the battery already shields most of the afternoon peak, so the gap between the battery's price and the off-peak price is only 0.04 PLN per kWh when the battery covers everything.
Three things would make me wrong. If the battery is empty at the peak more often than I expect, the saving grows toward the top of the range. If the coefficient of performance drops by more than a few tenths at the warmer off-peak hours the regulator moves heat into, the saving shrinks, and it can turn negative. And if the regulator holds the house at the top of the band to chase cheap hours, the cost of the extra heat can outweigh the shift.
The falsifiable part is this. If the share of heat pump energy in the afternoon peak does not fall, compared with the same months without the regulator, then the regulator is not doing what it was designed to do, whatever the savings figure says.
The language model layer#
There is one more part of the heating system that sits alongside the regulator, and it is deliberately narrow. A language model gives a bias of plus or minus half a degree to the room target, based on context the cost vector cannot see, such as the forecast over two to three days, the hot-water schedule and whether anyone is home. It writes a daily report at 07:00 and 22:20, with deterministic numbers from the statistics and a short comment from the model. A third function, an analyst, runs at 22:00 and may propose changes to three whitelisted parameters, within tight step and drift limits, but by default it only proposes. Each function has its own switch. The model never sets the pump's setpoint. I chose that boundary on purpose, because the model cannot measure the loop it would be steering, and it does not improve the arithmetic of a price vector.
Pitfalls, in the order they cost me time#
- A
choosetakes the first matching branch. Order branches from the most precise decision down to the emergency fallback, and log which one fired. maxandminlook alike and do opposite things. Write a test with an input below and above the cap.- A template sensor with no trigger does not reset on time. A "finished recently" sensor built on
now() - last_changedstays on until its source changes, because the template only re-evaluates on a source change. Add atime_patterntrigger or use atrigger:based template. - Signed power conventions differ between vendors. Pick one convention, derive unsigned helpers once, and forbid re-deriving them.
- Fallback values are dangerous in controllers. A sensor that reports zero when unavailable reads as the coldest possible day. Use
unavailableas the fallback and make the consumer handle it. - Holidays are not weekends. Any tariff or schedule logic that only knows weekends will misprice public holidays on working days.
- Two copies of a rule drift apart. A tariff zone defined in three places will be wrong in one of them within a year.
- The registry outlives the YAML. Delete an automation from the file and check the registry for an orphan.
- Statistics are not history. Recorder states expire; plan analysis around long-term statistics from the start.
- Cloud integrations disappear quietly. A vehicle integration that goes unavailable on sleep looks like a broken system. Check the device before the integration.
- Removing a host removes its only signal. When I removed a Proxmox integration I had not used, nothing in Home Assistant could say whether that host was up anymore. Removing an unused integration is fine; check what it was the only witness for.
Where it is, and what comes next#
As of this writing the battery and tariff logic runs live, with the decisions logged. The heating regulator is in shadow mode, waiting for a comparison with my manual setpoints and an explicit go-ahead before it writes. The hot-water optimiser is planned but not built. The sensor that gives the controller the true indoor temperature is installed. The winter data will arrive over the coming months, and I will publish the heating results in spring, once there is a control period to measure against.
The next concrete step is the comparison: the shadow recommendations set against the setpoints I chose by hand, for the same hours. If they agree on direction and disagree mainly on magnitude, the regulator is doing the right job with the wrong gain. If they disagree on direction, the cost vector is wrong, and I will not let it write.
The main lesson, which is more about controllers than about this house, is that the sensor, the sign convention, the tariff calendar and the write path are where a controller goes wrong. The clever part is the smallest part of the system.